When you start using GTM for the first time you may not need this, but with time you’ll start implementing more and more events, do more testing and debugging, and this will seriously disrupt your data. While this is easily fixed if you just filter your traffic in GA – it’s always better to have a backup plan. Another reason to use a separate property for your testing is to easily check your events, and not the events generated by your current visitors (this is especially valid in the Real Time report, where limited events are shown -20 rows, and if your site has huge traffic – you won’t be able to see your test events).
Good news everyone – all it takes to fix this is enabling one built in variable and create one simple Lookup Table Variable. Your debug traffic will be separated in no time!
Step One – Create a new property in Google Analytics
Create a new property in GA, which will be used to collect all the debugging data. You can name it as you wish (for example – ‘Debug – yoursite.name’). Don’t place any filters on it, it’s your personal debug property and you’ll want to see everything that goes on.
Step Two – Enable the Debug Mode
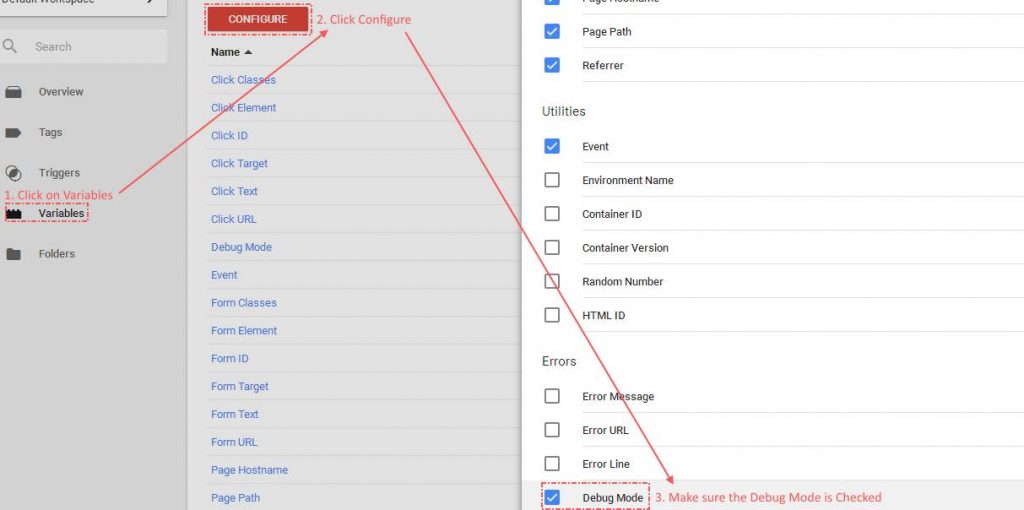
There is a built-in variable in Google Tag Manager called Debug. You just need to enable it, as it’s disabled by default:

What this variable does is returning true if you browse your website with Preview mode and false otherwise.
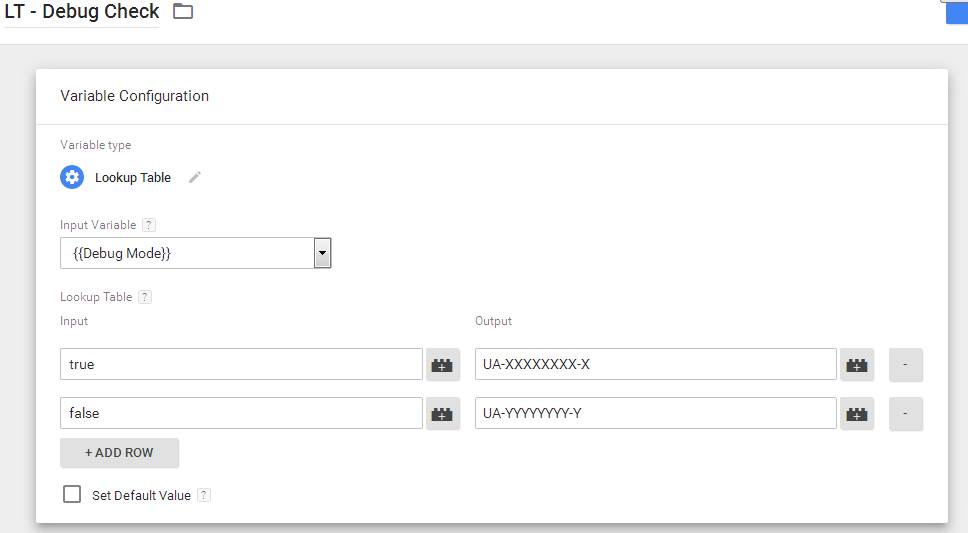
Step Three – Create the Lookup Table Variable
{{Debug Mode}} as input and add two rows.In the first row add as input
true. As output type the UA code of the newly created debug property.In the second row add as input
false and your original UA code as output (the one of your main Google Analytics property).
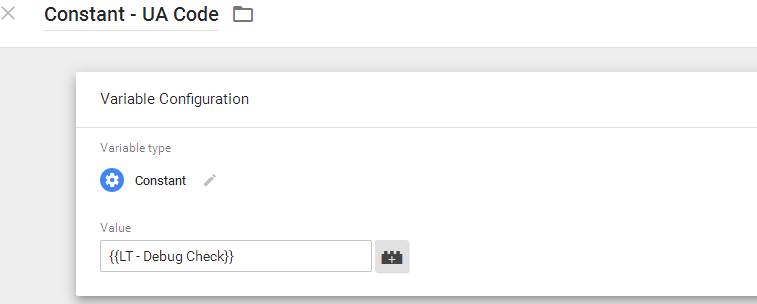
Step Four – Deploy the Lookup Table in your events
 If not – You’ll need to change the UA codes in all of your tags with the variable.
You just need to publish your container now and voila – you have your separate debugging property ready!